In 2007 and 2008, I posted on the State Data Center’s 2010 population projections and how population growth might affect the 2010 redistricting. Of interest to the legislative community is the North Carolina State Data Center population projections. Most recently updated September 8, 2009, the County Population Growth 2000-2010 dataset gives some ideas about the next round of redistricting scheduled for the 2011 legislative session. The Program on Public Life over at UNC-Chapel Hill has just released an electoral analysis based on those projections in its October 2009 data-net (see pages 5-8) . Based on the analysis, Wake is likely to gain two House seats and one Senate seat, and Mecklenburg is likely to gain one or two House seats. I say one or two seats for Mecklenburg because of an unexpected overlap in the mathematical formulas spelled out by the North Carolina Supreme Court earlier this decade. More below. Remember of course, all 2010 numbers are just projections.
Growth in an urbanizing pattern
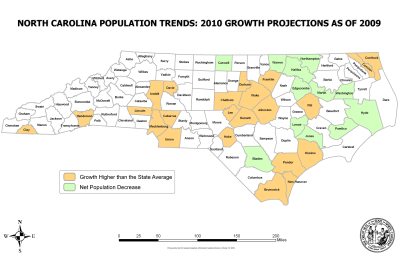
The 2010 estimates show a total estimated population growth for the decade of 19.0%, up from last year’s projections of 18.1%. Since the number of House and Senate seats is fixed at 120 and 50 respectively, counties that grow faster than the state average gain representation, while those with less lose representation. Just 23 of the 100 counties are projected to grow at a rate higher than the State average. Counties growing at a higher average are mostly around the Triangle, Charlotte area, and the coast. Twelve counties are projected to lose population, see the map below.
The 23 counties that are estimated to grow at a higher rate than the State average are:
Brunswick (51%), Cabarrus (40%), Camden (44%), Chatham (30%), Clay (23%), Currituck (27%), Davie (22%), Durham 23%, Franklin (27%), Harnett (28%), Henderson (20%), Hoke (39%), Iredell (33%), Johnston (43%), Lee (22%), Lincoln (23%), Mecklenburg (31%), New Hanover (23%), Onslow (21%), Pender (34%), Pitt (22%), Union (70%), and Wake (49%).
Net increase in House seats
The six counties with the biggest projected net increase in House seats are: Wake 2.37, Mecklenburg 1.05, Union 0.79, Johnston 0.3, Cabarrus 0.35 and Brunswick 0.29. Senate gains would be in the same proportion. Remember of course, all 2010 numbers are just projections.
The Stephenson cases
The North Carolina Supreme Court in its 2002 Stephenson I opinion and 2003 Stephenson II opinion said that all districts must be within plus or minus 5% of population equality, and absent Voting Rights Act consideration, any county entitled to a whole number of seats (within the 5% tolerance) will have all those districts as subsets within that county. This is often referred to as a “single-county cluster”, and simplifies the beginning part of redistricting. The Supreme Court forumla did not forsee that the growing urbanization of the State will push Mecklenburg and Wake Counties to more than 10 seats, a point at which the number of seats that satisfy the whole county provision can begin to overlap. Current projections show Mecklenburg entitled to 11.42 House seats in 2010. The court formula for 11 seats is +/- 5% from 11, which is 10.45 to 11.55. The court formula for 12 seats is +/- 5% from 12, which is 11.40 to 12.60. The projected 11.42 falls within the range for either 11 or 12 seats. If this happens, will the General Assembly have total discretion which number to use? Perhaps more likely the number that best satisfies the Voting Rights Act on a statewide basis might be the best one to use.
Single county clusters in 2000 and 2010
In 2000 there were three single-county clusters in the Senate: Wake 4, Forsyth 2, and New Hanover 1. In 2000 there were ten single-county clusters in the House: Alamance 2, Buncombe 3, Cabarrus 2, Guilford 6, Lincoln 1, Mecklenburg 10, Randolph 2, Rowan 2, Wake 9, Wilkes 1. Pitt would have been a 2 seat single-county cluster except for division on account of the Voting Rights Act.
For 2010, projections show five single-county Senate clusters, Mecklenburg and Wake each with 5 seats, and Cabarrus, Onslow and New Hanover each with 1 seat. In the House projected single-county clusters are: Alamance 2, Buncombe 3, Caldwell 1, Catawba 2, Cumberland 4, Davidson 2, Guilford 6, Iredell 2, Lincoln 1, Mecklenburg 11 or 12, and Wake 12. Pitt would still be a 2-seat single county cluster were it not for the Voting Rights Act. Wilson would be a 1-seat single county cluster Remember of course, all 2010 numbers are just projections.
Urbanization
A look at clusters of counties around the Triangle, Triad, and Charlotte area show the following changes in House seats for a region. (Senate changes would be proportional)
Triad: Alamance, Davidson, Forsyth, Guilford, Randolph, and Rockingham. Drops from 18.31 in 2000 to a projected 17.46 seats for 2010. (-0.85).
Triangle: Chatham, Durham, Franklin, Orange, Johnston, and Wake. Increases from 17.67 to 20.58 seats. (+2.91). Interestingly from 1973 through 1982, these six counties had 13 seats. This is a 59% increase in representation for these six counties in 40 years.
Charlotte area: Cabarrus, Gaston, Iredell, Lincoln, Mecklenburg, and Union. Increases from 19.79 to 22.06 seats. (+2.27).
Population Trends Map
I’ve posted an image of a population trend map- below, an online .pdf file of the map is here . Population changes are shown in two colors, the counties that have grown faster than the State average (shown in orange) and counties that are projected to have a decline in population (shown in green – the lighter color on a black and white printer)
(thanks to Raleigh Myers for assistance with the map)


 Posted by gercohen